
Part 1 of this interview explained the relationship between big data and IoT, and the basics of Time Series. Part 2 will expose some real world examples of Mediaflux’s Time Series in action, before exploring how this can be applied to other industries experiencing a rush of IoT data to bring new ideas to market.
Arcitecta has worked within National Security for many years now, how can Mediaflux time series add value in that field?
It’s a complex topic, but boils down to providing useful information as rapidly as possible. It’s often referred to in the US Military as the OODA Loop (Observe, Orient, Decide, Act). The faster you can acquire/process information and direct peoples attention to it, the faster a decision can be made whether action is required. Mediaflux plays a role in this loop by acting as a orchestration engine where metrics recorded by time series can drive external processing and alerting with the aim to greatly reduce the time to getting human eyes on a potential threat.
Take for example a littoral maritime use case. Threats to a naval dockyard are being monitored and one of the criteria is tracking vessels speeding through a slow navigation lane on an approach to the dockyard.
A traditional approach would involve exporting Vessel Location Reports from a system designed to record AIS feeds. That data would then be added to a data analytics system to be filtered by speed and the geofence of the slow navigation zone. These filtered metrics may then be pushed to a Machine Learning solution to provide further context. The time to get to that point through multiple steps is considerable and costly. Based on discussions we’ve had with customers and partners it can involve “farms” of servers to collect and process.
With Mediaflux, they can execute one query, hit return and reach the same outcome within seconds; moreover we can provide additional context well before the need for Machine Learning.
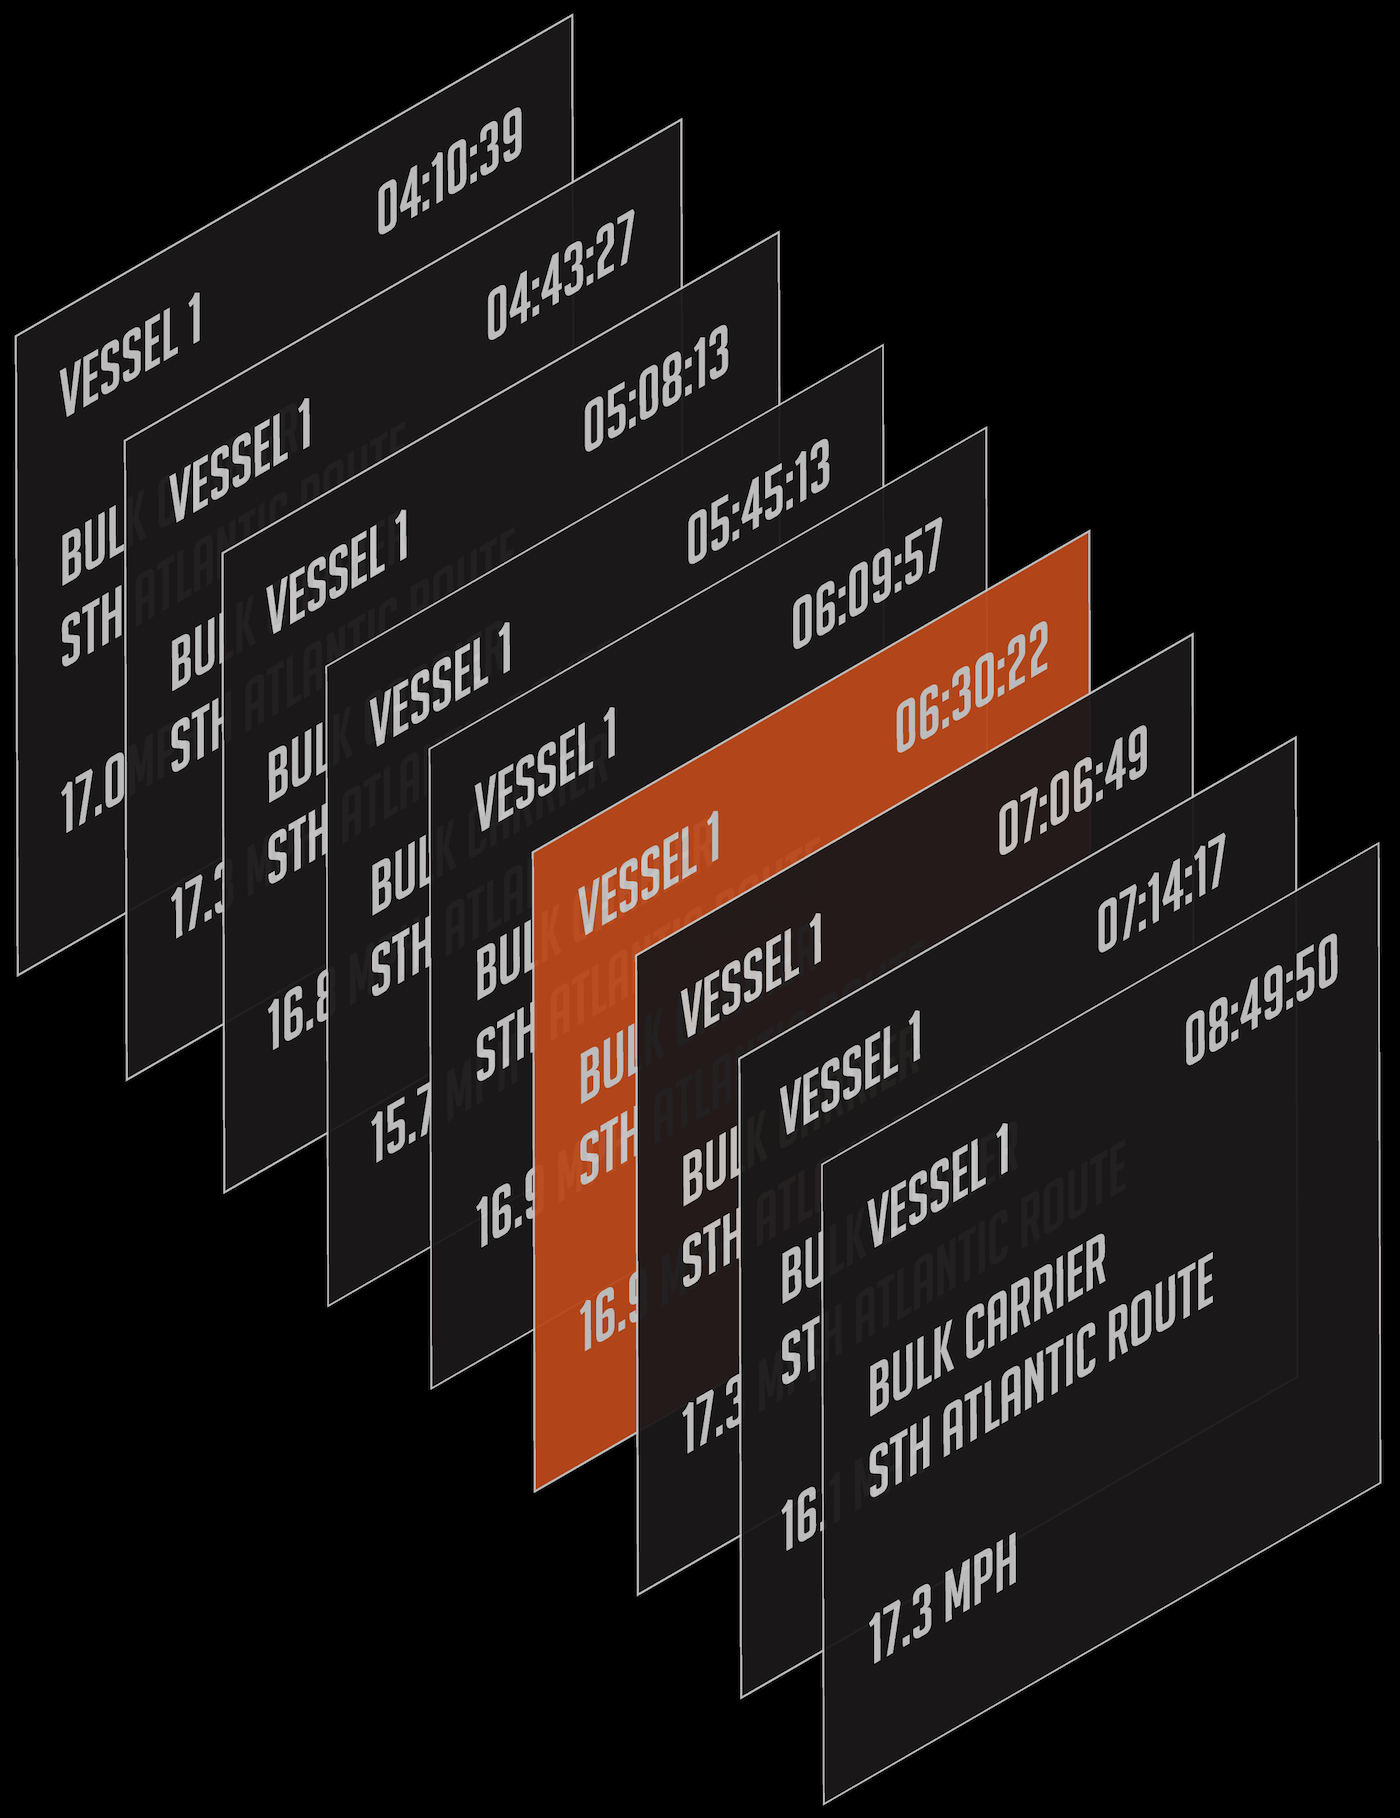
AIS feeds are persisted in time series against objects per vessel. We then enhance each vessel record with lineage metadata and imagery. We can create event-based alerting which tracks state over time per object. In the slow navigation zone use case we could create an alert which states “raise an alert if any vessel over 200m in length travelling into the channel through the slow navigation geofence exceeds 9 knots for more than 5 minutes” or “raise an alert if any vessel over 200m in length travelling into the channel which is outside slow navigation geofence for more than 3 minutes”
Mediaflux would be able to provide the vessels MMSI, Name, Length, Registry, current location, speed & bearing, recent port visits and any ABI reports recorded against the vessel. Additionally, Mediaflux could then further show all previous times these vessels had met the same criteria even prior to the alert being configured. This can provide useful context to determine if this is outside a common pattern of behavior here or elsewhere.
Once you've got the time series data associated with an asset, with metadata against it, Mediaflux let’s you slice and dice the data sets really easily.
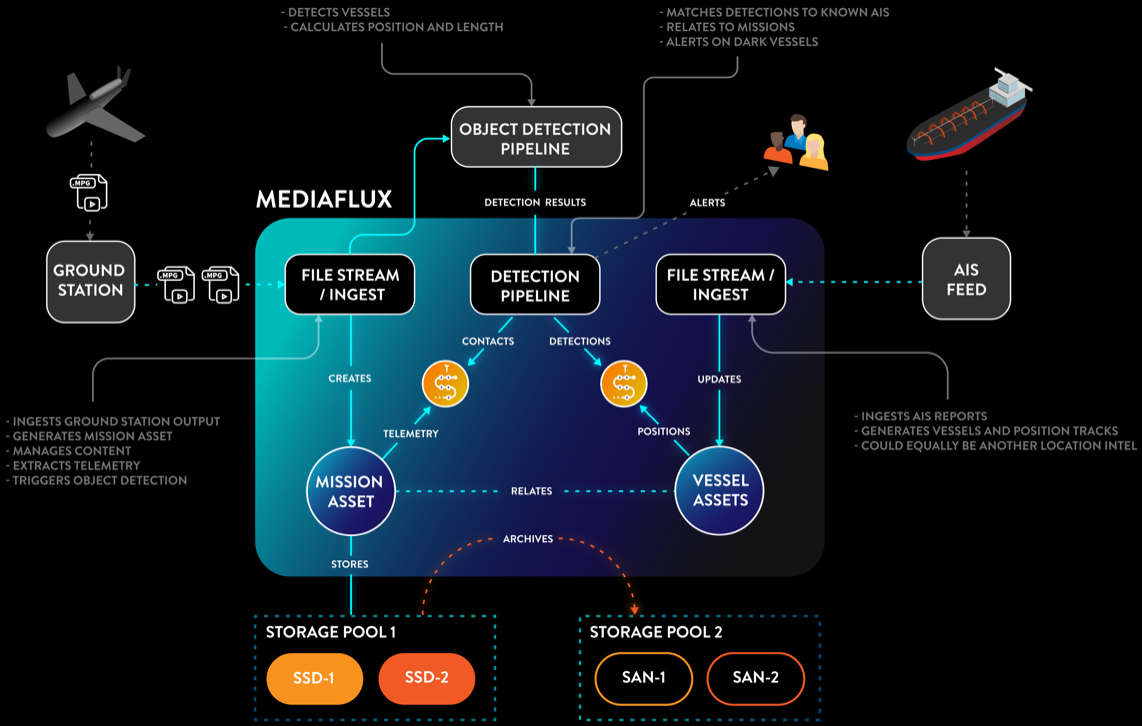
The picture becomes even more interesting when we merge this repository of data with detections from orbital and airborne sensors. Satellite imagery and sensors mounted on High Altitude Long Endurance ISR or WAMI platforms can provide “imagery” which can be processed by computer vision systems able to detect length, width and sometimes vessel class.
These spatial detections can be correlated against known AIS reports and used to detect not only, so called “dark vessels” (vessels not emitting AIS) but also vessels spoofing AIS of other vessels by comparing the vessels measurements against those known from records.
Considering how many sensors are expected to be out there in the future, do you think these kinds of results are reproducible at an even greater scale?
This is where generic time series stuff really struggles to do what Mediaflux does intrinsically. Because our time series is not a separate system to where we store the data, it's part of the same system, these results are easily reproduced quickly even as data scales – simplicity scales.
There are companies out there that will say that they can scale because they have 20 servers that do all this and that and that you can paralyze it and everything else. But the reason they need 20 servers to do it is because they can't do in one system. For them, it's not possible.
What is important to think about here is that the ultimate goal is to help the people who are actually using the data. Would they rather have the result in two seconds from one big system that can store all the data or would they rather have 20 big expensive servers but wait 20 minutes for their data?” The answer is always to have that one system.
Do you think sometimes when you explain this to customers they don’t believe you? It sounds a little too good to be true.
There was recent conversation were we demonstrated some of this capability to another vendor. They said something along the lines of “Holy cow… Nobody else in this room probably understands exactly what you've just done. Nobody else I know of can do that. That is ridiculous.”
They had been working on a project with an unnamed commercial client in Western Australia where they had in excess of 25 servers deployed to process similar but unrelated data. Based on the information supplied, Mediaflux absolutely smoked it in ingest and query performance. “You just did that on a bloody MacBook with like 16GB of RAM”.
This is the power of the Mediaflux query engine with Time Series in there. If it needs to be seen to be believed, let’s start a conversation.
Read part 3: Autonomous vehicles.
Attribution
Thumbnail/Cover Image — Image by Paul Frenzel on Unsplash.