
By next year it is predicted that 1,000,000 petabytes of data will be generated through the Internet of Things (IoT). Without this data, billions of sensors and devices connected to the internet would not hold the functionalities and capabilities that have made them achieve so much worldwide attention. Now is the point where the role of big data in IoT comes into the picture. Over the next couple of weeks, I will be speaking with Arcitecta to understand how Time Series with Mediaflux can be used by IoT data scientists to make sense of all this data, speed up discovery, and discuss some of the current and future applications in geospatial mapping and autonomous vehicles.
Let’s start at the beginning, with the Internet of Things. The term “IoT” gets thrown around a lot in various tech discussions, what’s your take on IoT?
IoT is a very overloaded term but commonly it means a sensor of some type that has the ability to transfer data over a network without requiring human-to-human or human-to-computer interaction. This can be thought of as something that is recording metrics or information and send them back to some central repository, optionally providing some processing at the edge.
You could think of it in the context of autonomous vehicles. You've got all these vehicles out on the road and each one has metrics about its travelling speed, engine temperature, the last time it was started or how many kilometers it has travelled. All these little pieces of information are retained; some of them are sent to a database and some of them are persisted in the device. This is big data in the context of the IoT.
For a non-technical person, what are some simple examples of using big data in IoT?
All these pieces of information vary over time depending on changes in conditions. Take a smart appliance, a fridge, for example. Using these tiny pieces of data, we know that if there's a massive rise in temperature and then it drops again, someone has probably opened the door – all those bits of information are sent into a central repository. The manufacturer would collect this time series data to reveal trends in customer behavior over a long time that could affect how they develop the product in the future.
Similarly, few people will ever buy into self-driving cars as a viable option for the future of transportation unless we can demonstrate better than human performance. Therefore, the more usable data from cameras and sensors used in test drives, the safer autonomous cars become.
This is commonly done either over the Internet, some sort of cloud, or something like low power wide area networking. LPWAN, LoRa and LoRaWAN are forms of network like your 3G or 4G sim, except it uses a different kind of radio frequency that works over a much wider area to send tiny little bits of information. The time series data could be as little as 2k, it’s really just enough information to say something like “Device 4637 is 22.65℃ right now”. Over a long period of time, what you end up with is a large amount of information accumulating in a central database, like Mediaflux, via some sort of entry point.
So this is really a lot of very small packets of information over time. How is anyone meant to make sense of it all?
This type of information, appearing over time, is stored in what is called a time series. In diagram 1, you can see an example of a time series ingesting the current temperature of a fridge. The temperature gets fired into the database as a number, here its 4.5 °C on its first ping. Over time, this keeps getting fired into the system; 4.4 °C, 4.4 °C, 4.5 °C, 4.6 °C, 4.6 °C.
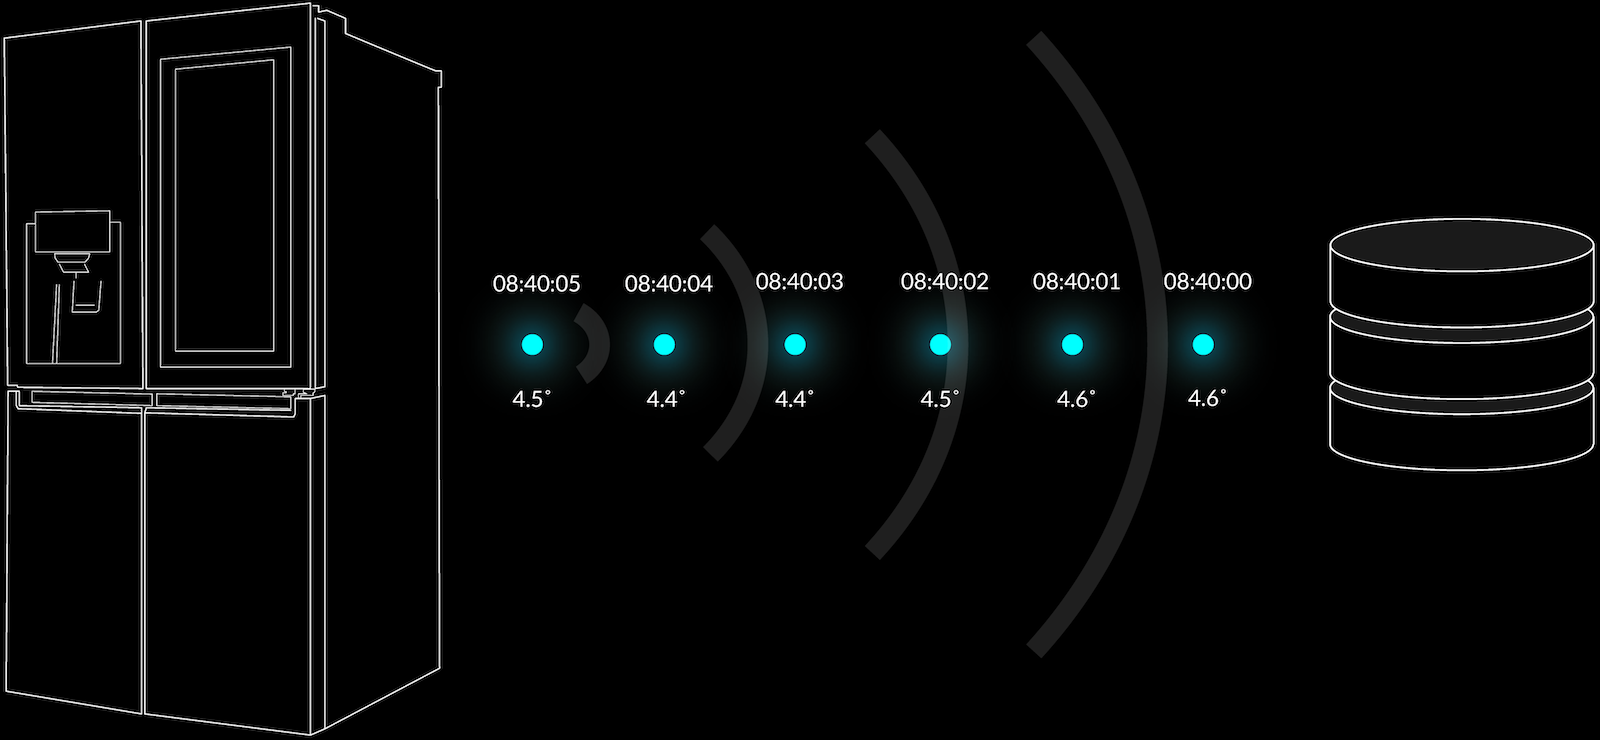
The temperature has gone up and down very slowly, and these values have been ingested into this time series with some sort of value attributed to it in relation to time.
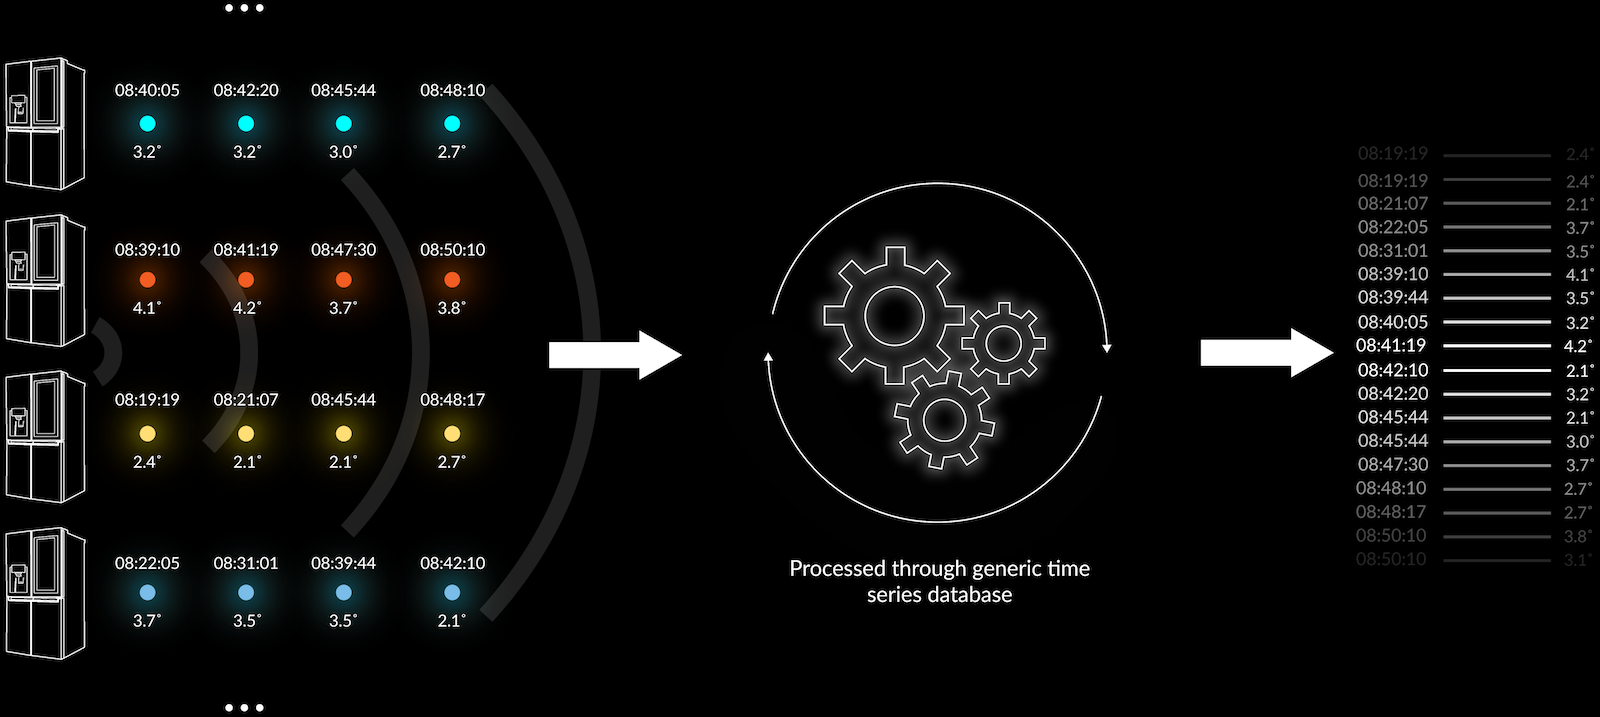
Now, if you look at diagram 2, this is how some databases out there let you put in a fragment of information. The information that goes into that database is entirely arbitrary, you don't know what it is – it's just commonly heaped together. It’s one big stream of data interspersed with information from, say, many fridges.
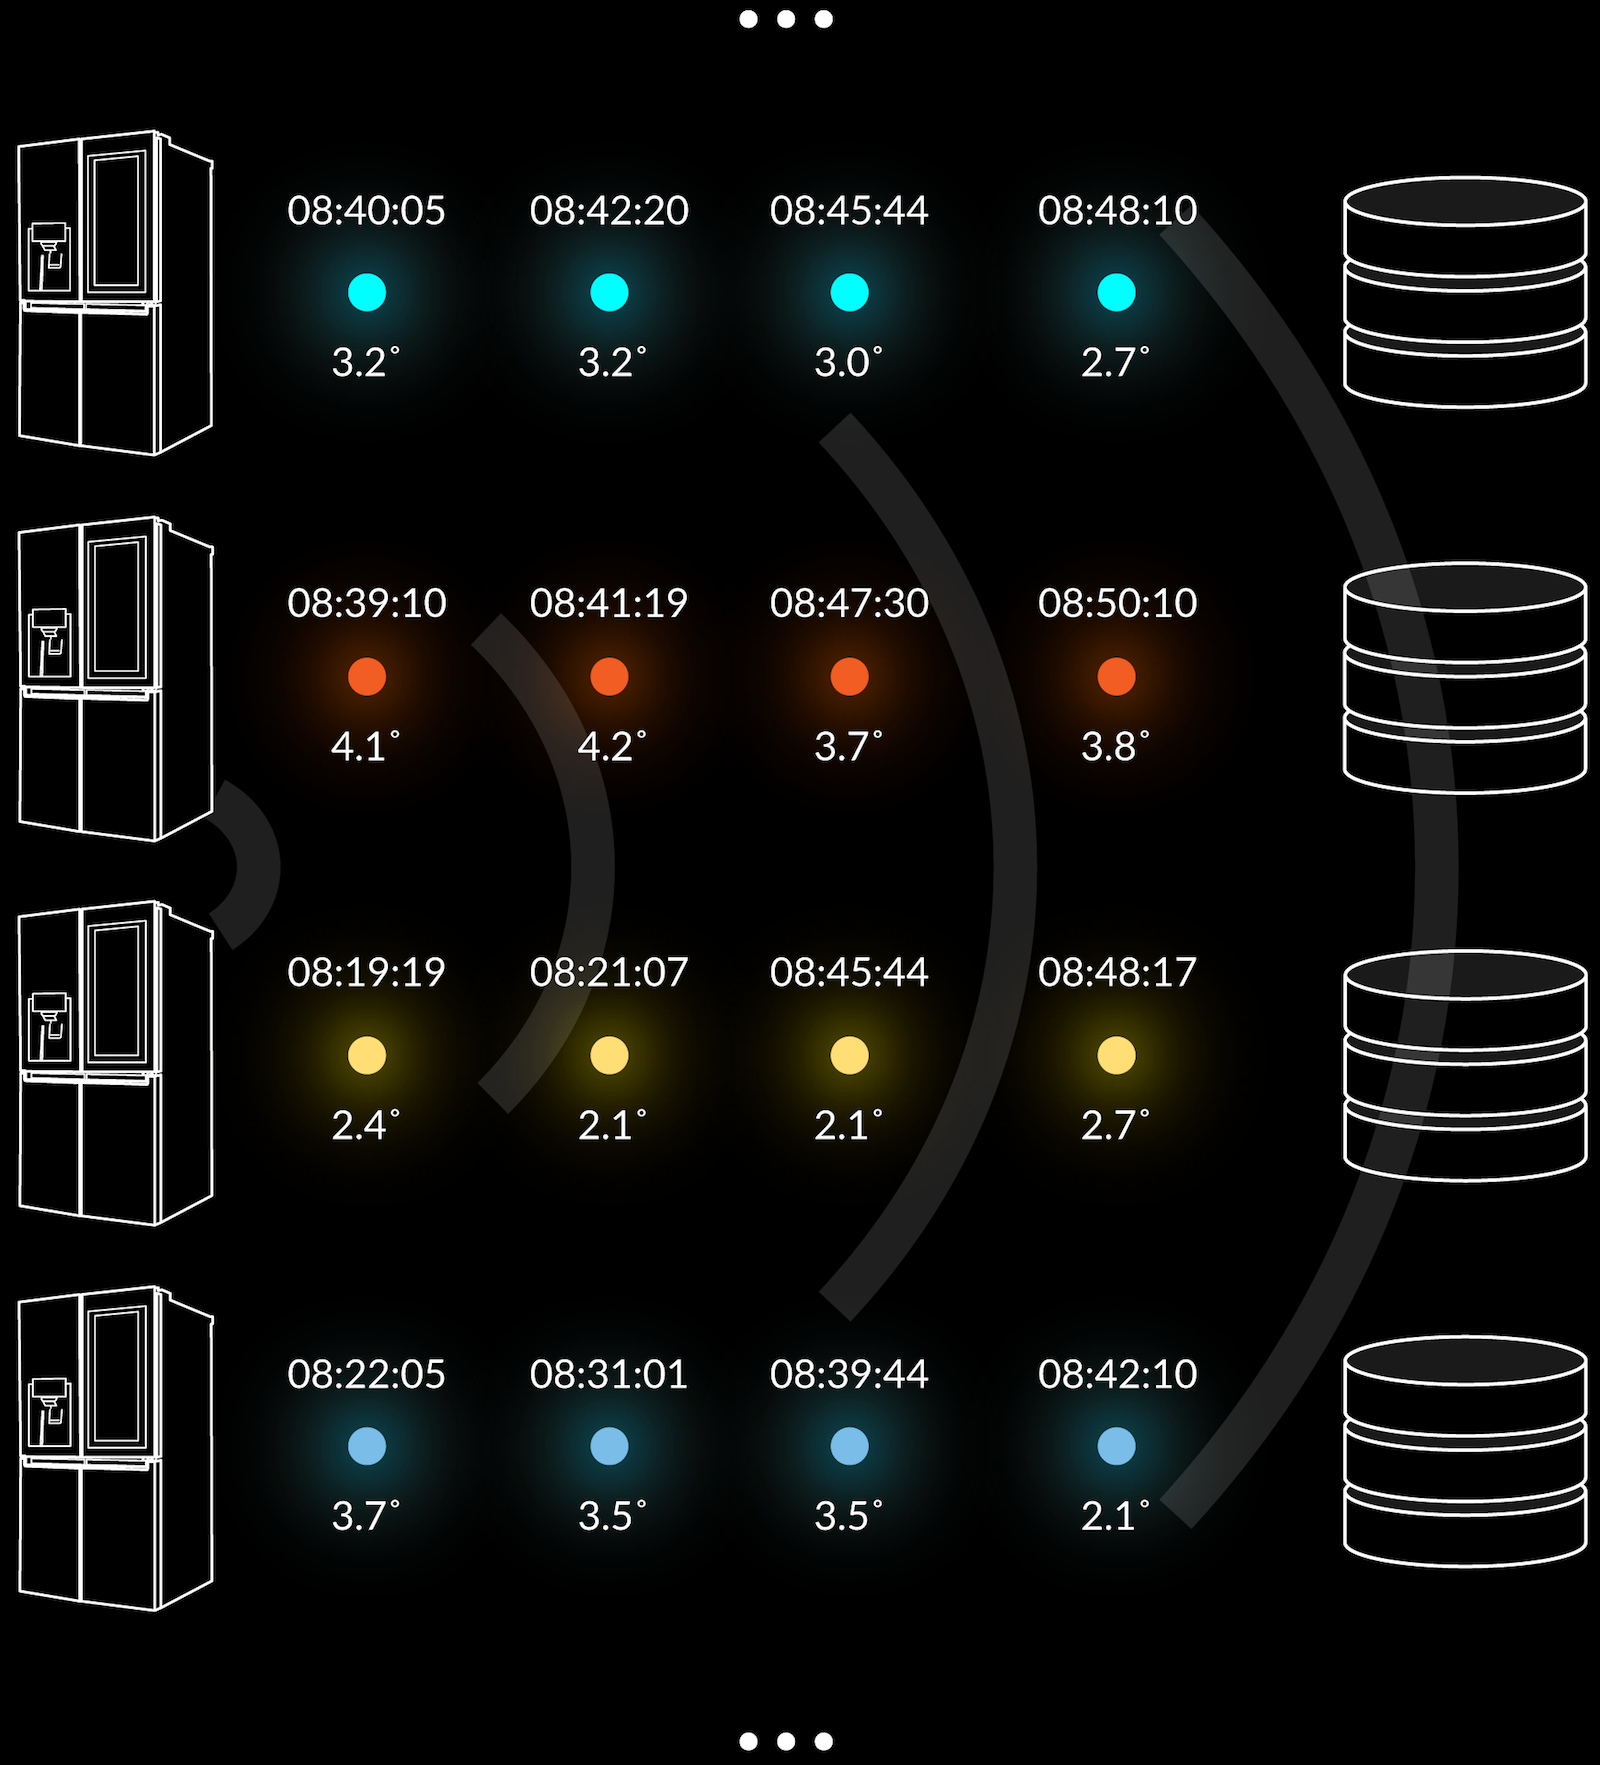
What you end up with in a system like that shown in the diagram above – in fact most time series systems – is a big long list of metrics of various types, but the metrics are commonly not grouped or governed by any schema and can have varying structure. A generic time series solution will get around this by persisting information from different things in multiple individual time series databases, like you can see in diagram 3 below.
But what if you have 15,000 fridges or vehicles to monitor out in the market?
You could theoretically have 15,000 of these groupings (pictured in diagram 3) with each fridge feeding information into the same time series, but this is far from an optimal solution. The cost of querying the time series can be cripplingly high.
What is the problem with a single stream of data for multiple fridges?
Say you wanted to query “how many fridges do we have on record from manufacturer X which are within warranty and have never been serviced, but have had an internal temperature range exceed 8℃ for more than 30 minutes” or “what is the average number of times people within Greater London open their fridge between 2:00 am and 4:00 am”. You would have to crawl all the way through one vast stream of data to find the metrics for those fridges and then correlate them against an external database, possibly more than one, to find this information. This often involved data warehouses and ETL (transformation) processes. This is very tedious and slow.
How is this different from using Mediaflux’s Time Series?
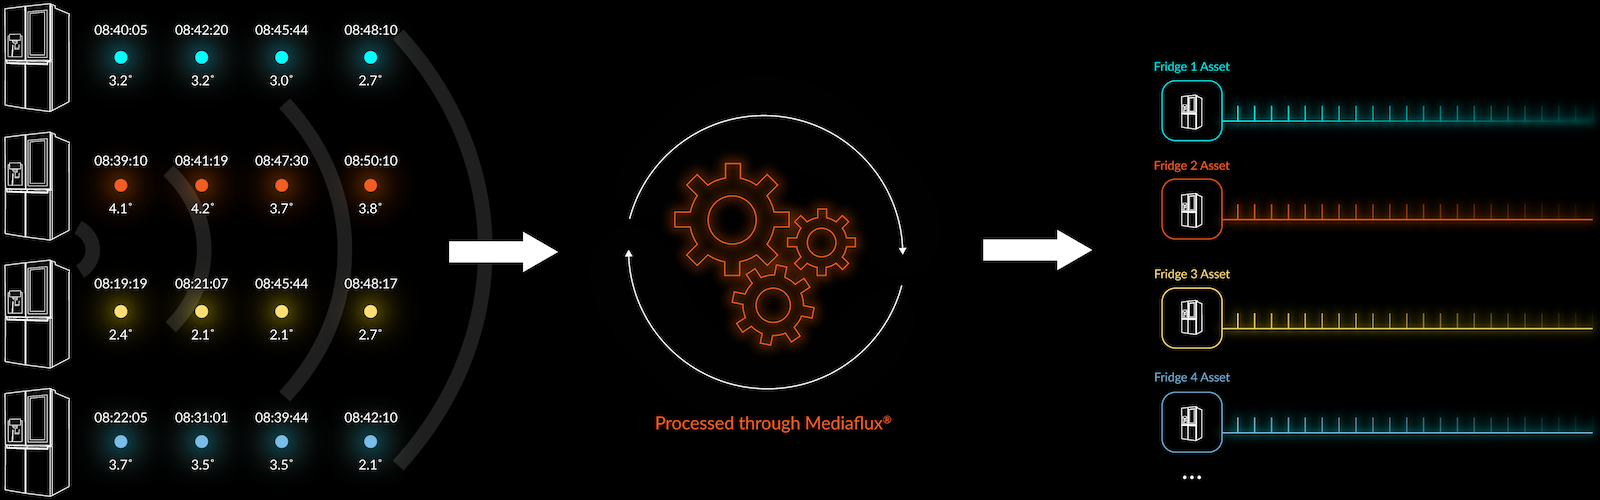
The way we do it in Mediaflux is that we define one of more attribute structures, which can optimally include location information, and apply these as time series to unique objects. In diagram 4 you can see a time series for a group of fridges, the time and the temperature. Here there are four fridges, these are what we call assets in Mediaflux.
Now, this is where is gets interesting because assets mean that the way we collect data isn't constrained by just having one type of index on time series data, as in the previous examples.
Mediaflux defines what the time series is going to include and then we create one or more time series that hangs off the bottom of the asset. In this instance, when any of the fridges sensors report into Mediaflux, the system automatically recognises “that's one for Fridge 345 that goes in there with the rest of fridge 345 time series”, and these get added like this over time from any number of sensors.
The information might come through in time related order or in packets of information or it might come in staggered with no order. Regardless, Mediaflux can automatically filter it out and group it into the correct place grouped by assets.
Just as each fridge would be its own asset, in the case of automated vehicles reporting their location and trip information, each one of these assets would be a car. Let’s come back to this later.
So, what your saying is that “assets” make the time series data much easier to make useful?
Exactly, and in addition to using assets to manage time series more easily, Mediaflux gives that asset metadata to manage the assets more easily. So overall its much more efficient.
Mediaflux would create objects (assets) for each fridge including metadata for ownership, lineage and warranty metadata then map the fridges metrics to the fridge specific time series. We can seamlessly merge the object related metadata, temporal, spatial and relationship data with any number of time series metrics.
For example, a few fragments of metadata could show what the autonomous vehicle is, who manufactured it, what its history is or whatever else we choose to attach to it. This makes is really easy to turn around and say “I want to find all the vehicles that are manufactured by X company”, and boom, that’s sliced the data one way. The same applies for even more complex queries, such as “I want to find all vehicles manufactured in 2017 and purchased in 2019 with an average speed between 30 and 60 where the battery takes longer than 4 hours to charge”.
It’s that easy to get real insight right inside the platform?
That’s right. It is very easy to say “I want to know the percentage of charging at home vs at work for people living outside of Sydney CBD who drive into work in the city.”
From what our customers are telling us, this is exponentially faster than crawling through billions and billions and billions of time points in one big time series looking for them all, and that’s just step one. Mediaflux filters data down by the assets (cars) and is also capable of deriving statistics on the time series, right inside the platform. This is very unique and offers an immediate benefit to data analysts. It can greatly speed up Machine Learning pipelines by often removing multiple stages of data filtering prior to the first pass.
The difference with Mediaflux, is that we've got the statistical analysis capability inside the box. We are able to run processes against the data because the query is run against the asset that already has metadata attached. It’s much more simple and efficient.
Read part 2: Beyond the Fridge.
Attribution
Thumbnail/Cover Image — Image by Joshua Sortino on Unsplash.